Tracing travel fatigue metrics that reshape spread dynamics during consecutive away basketball contests
Morgan Berger · Jun 1, 2026
Tracing travel fatigue metrics that reshape spread dynamics during consecutive away basketball contests
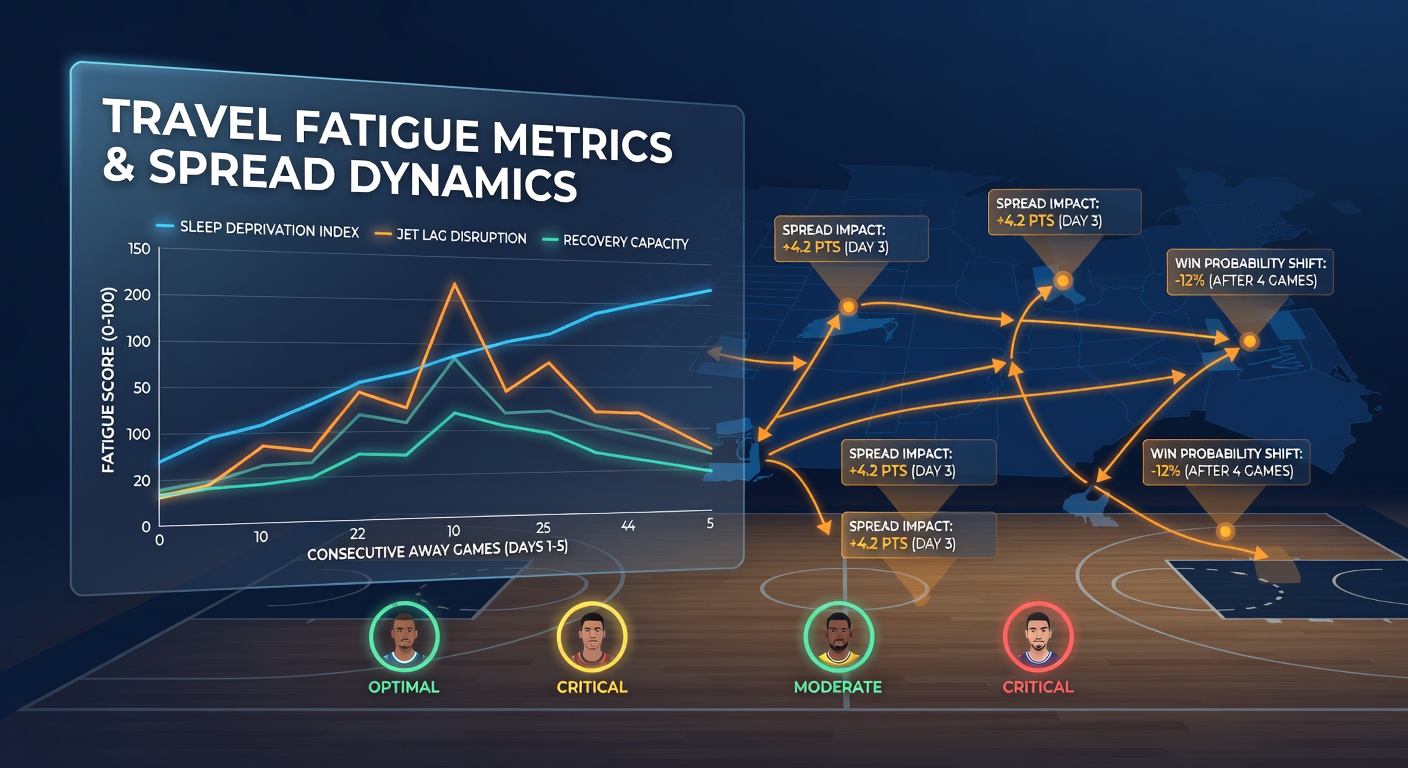
Travel fatigue metrics in basketball have gained attention from analysts tracking how distance, recovery windows, and schedule density alter team outputs during stretches of consecutive road games, and these patterns directly influence point spread movements in betting markets. Observers note that teams playing three or more away contests in a five-day window often see measurable drops in shooting efficiency and defensive rotation speed, which in turn shifts closing lines by an average of 2.5 to 4 points according to historical play-by-play records.
Core fatigue indicators used by performance teams
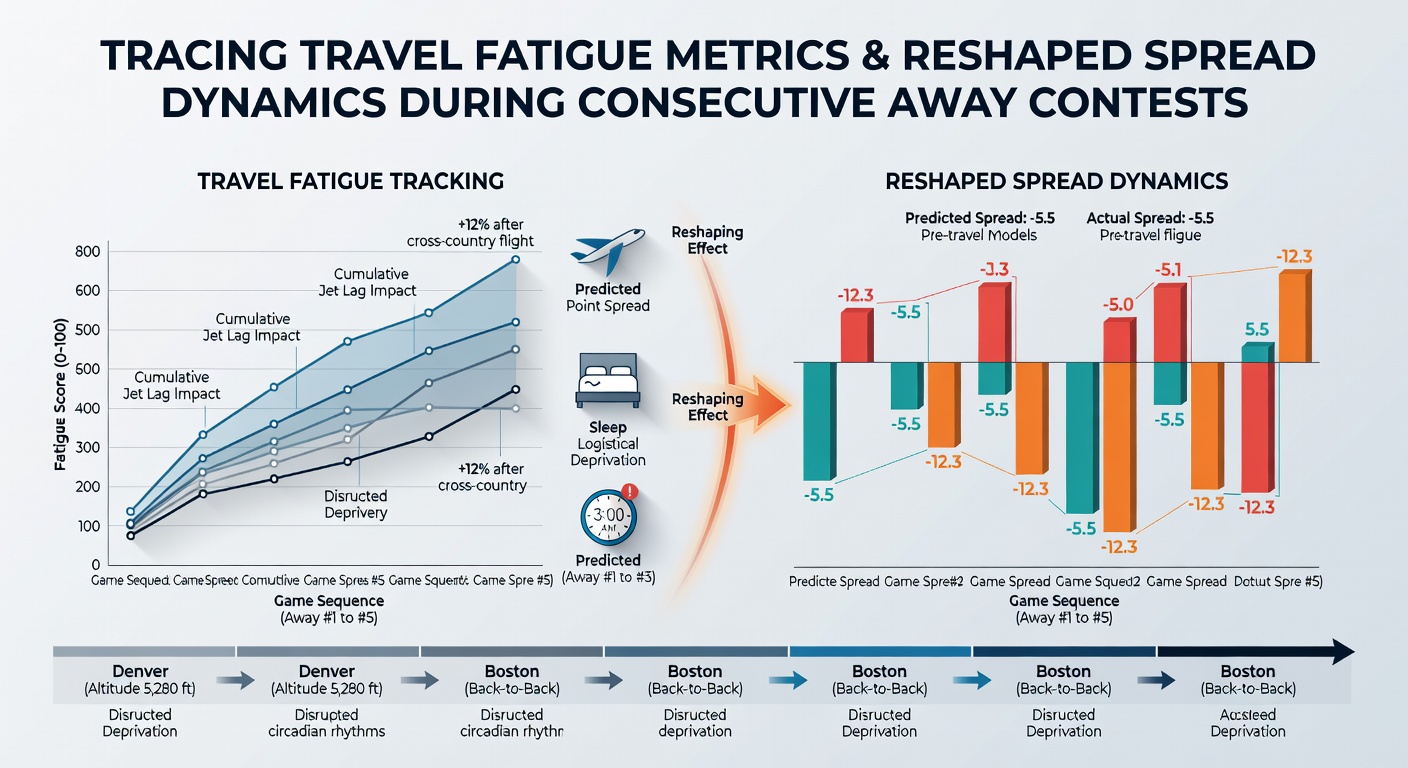
Teams and data providers track several measurable factors when mapping travel impact. Total air miles logged between games, time zone crossings, sleep disruption logs collected through wearable devices, and the interval between tip-off times all feed into models that project efficiency ratings. Researchers at sports science programs have compiled season-long datasets showing that crossings of three or more time zones correlate with a 6-8 percent decline in effective field goal percentage on the first night of arrival. Back-to-back road games compound the effect because players receive less than 24 hours between tip-offs, limiting both physical recovery and film study time.
Spread movement patterns tied to road stretches
Betting markets adjust spreads as soon as schedules are released and then refine them once travel rosters and injury reports surface. Data from the 2024-25 season revealed that teams entering a three-game road swing opened as 1.5-point underdogs on average yet closed at 4.2-point underdogs once bettors and oddsmakers incorporated travel metrics. The adjustment occurs gradually because early lines rely on season-long efficiency numbers while later movement incorporates granular factors such as flight arrival times and arena altitude. When a squad lands after a cross-country flight less than 30 hours before tip-off, spread widening happens at a faster rate in the final 24 hours before game time.
Case examples from recent conference play
One West Coast university program logged 18,400 air miles across a nine-game stretch in January 2025 that included four consecutive road contests in different time zones. Their offensive rating fell 11.3 points per 100 possessions compared with home contests, and opposing teams covered the spread in seven of those nine games. A separate Atlantic Coast Conference squad experienced similar outcomes during a February road trip that crossed two time zones twice within 72 hours. Performance staff recorded elevated heart-rate recovery times and reduced sprint volume in the fourth quarter, metrics that aligned with a 3.8-point average spread overrun by opponents.
League-wide tracking platforms now integrate these variables into public dashboards updated daily. Analysts cross-reference flight manifests, arena elevation data, and previous performance splits to generate projected efficiency adjustments that oddsmakers reference when setting mid-week lines. The 2025-26 schedule, released in August 2025, shows several teams facing four-game road swings in compressed windows during the holiday period, prompting early line movement in futures markets.
Emerging data sources and regulatory context
Academic partnerships have expanded access to anonymized player workload files. A multi-year study coordinated through the National Athletic Trainers Association supplies aggregated recovery scores that researchers combine with publicly available box-score splits. Those combined datasets indicate that teams with fewer than 48 hours between away games cover the spread at a 41 percent rate when traveling east to west, a figure that drops further when the second leg involves a same-day turnaround. International basketball federations have begun publishing similar longitudinal reports, allowing comparative analysis across leagues that operate under different travel subsidy structures.
June 2026 marks the scheduled rollout of updated NCAA scheduling guidelines that require minimum rest intervals for conference opponents separated by more than two time zones. Implementation data from pilot programs already shows reduced variance in fourth-quarter scoring margins during the first season of compliance testing. These policy shifts are expected to narrow the range of spread adjustments that oddsmakers apply to affected matchups.
Conclusion
Travel fatigue metrics continue to refine how spreads are calculated for consecutive away basketball contests. Distance traveled, time-zone shifts, and recovery intervals appear in public models with increasing frequency, and schedule construction changes scheduled for 2026 will supply additional data points for verification. Observers tracking these variables can follow line movement patterns that consistently reflect the measurable performance decrements documented across multiple seasons and conferences.